
It is amazing what you can do with a simple tool such as Excel. In this series, I share some of my spreadsheets. They cover many topics, including multiple types of regression, model-free confidence intervals, resampling, an original technique known as hidden decision trees, scatter plots with multiple groups, advanced visualization techniques, and more. No plug-in is required. I don’t use macros, pivot tables or any advanced Excel feature. In part 1 (this article), I cover the following techniques:
Spreadsheet 1: PB-inference.xlsx
- Model fitting and Rayleigh test for spatial point processes
- Automatically detecting the number of clusters (elbow rule)

Figure 1: Test of independence
Spreadsheet 2: PB-independence.xlsx
- Strong test of independence – not your typical Chi-squared
- Minimum contrast estimation – when the model parameters are hidden
- Dual confidence regions (see here)
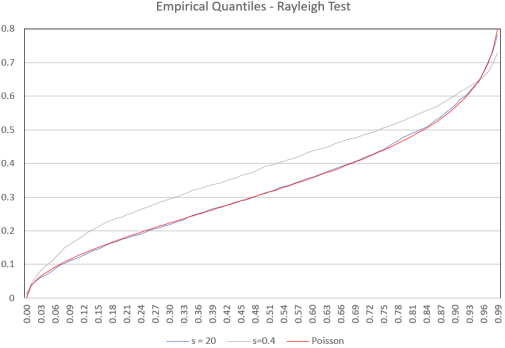
Figure 2: Model fitting
Dual confidence regions are simple, intuitive 2D generalizations of confidence intervals. You can find the two spreadsheets on my GitHub repository here.

Figure 3: Minimum contrast estimation
For a detailed description of the spreadsheets, see my new book. In Part 2 of this series, I will share more spreadsheets. They will be described in my upcoming book Machine Learning with Excel. To get updates about the upcoming books and spreadsheets, sign-up to our newsletter, below.